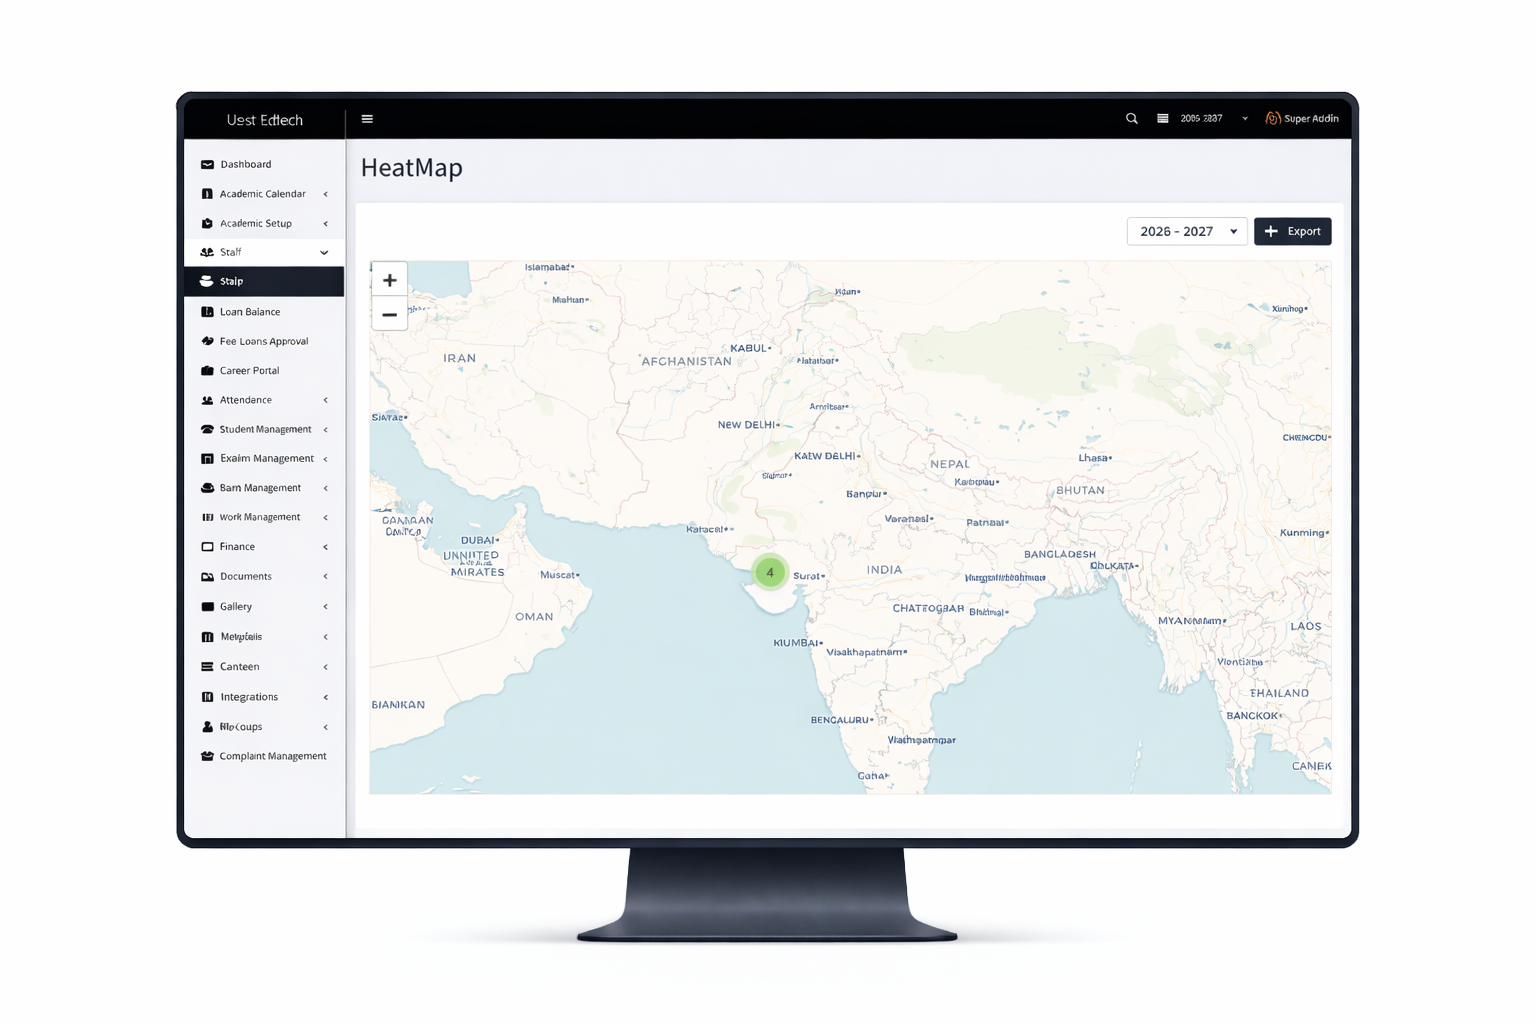
AI Features
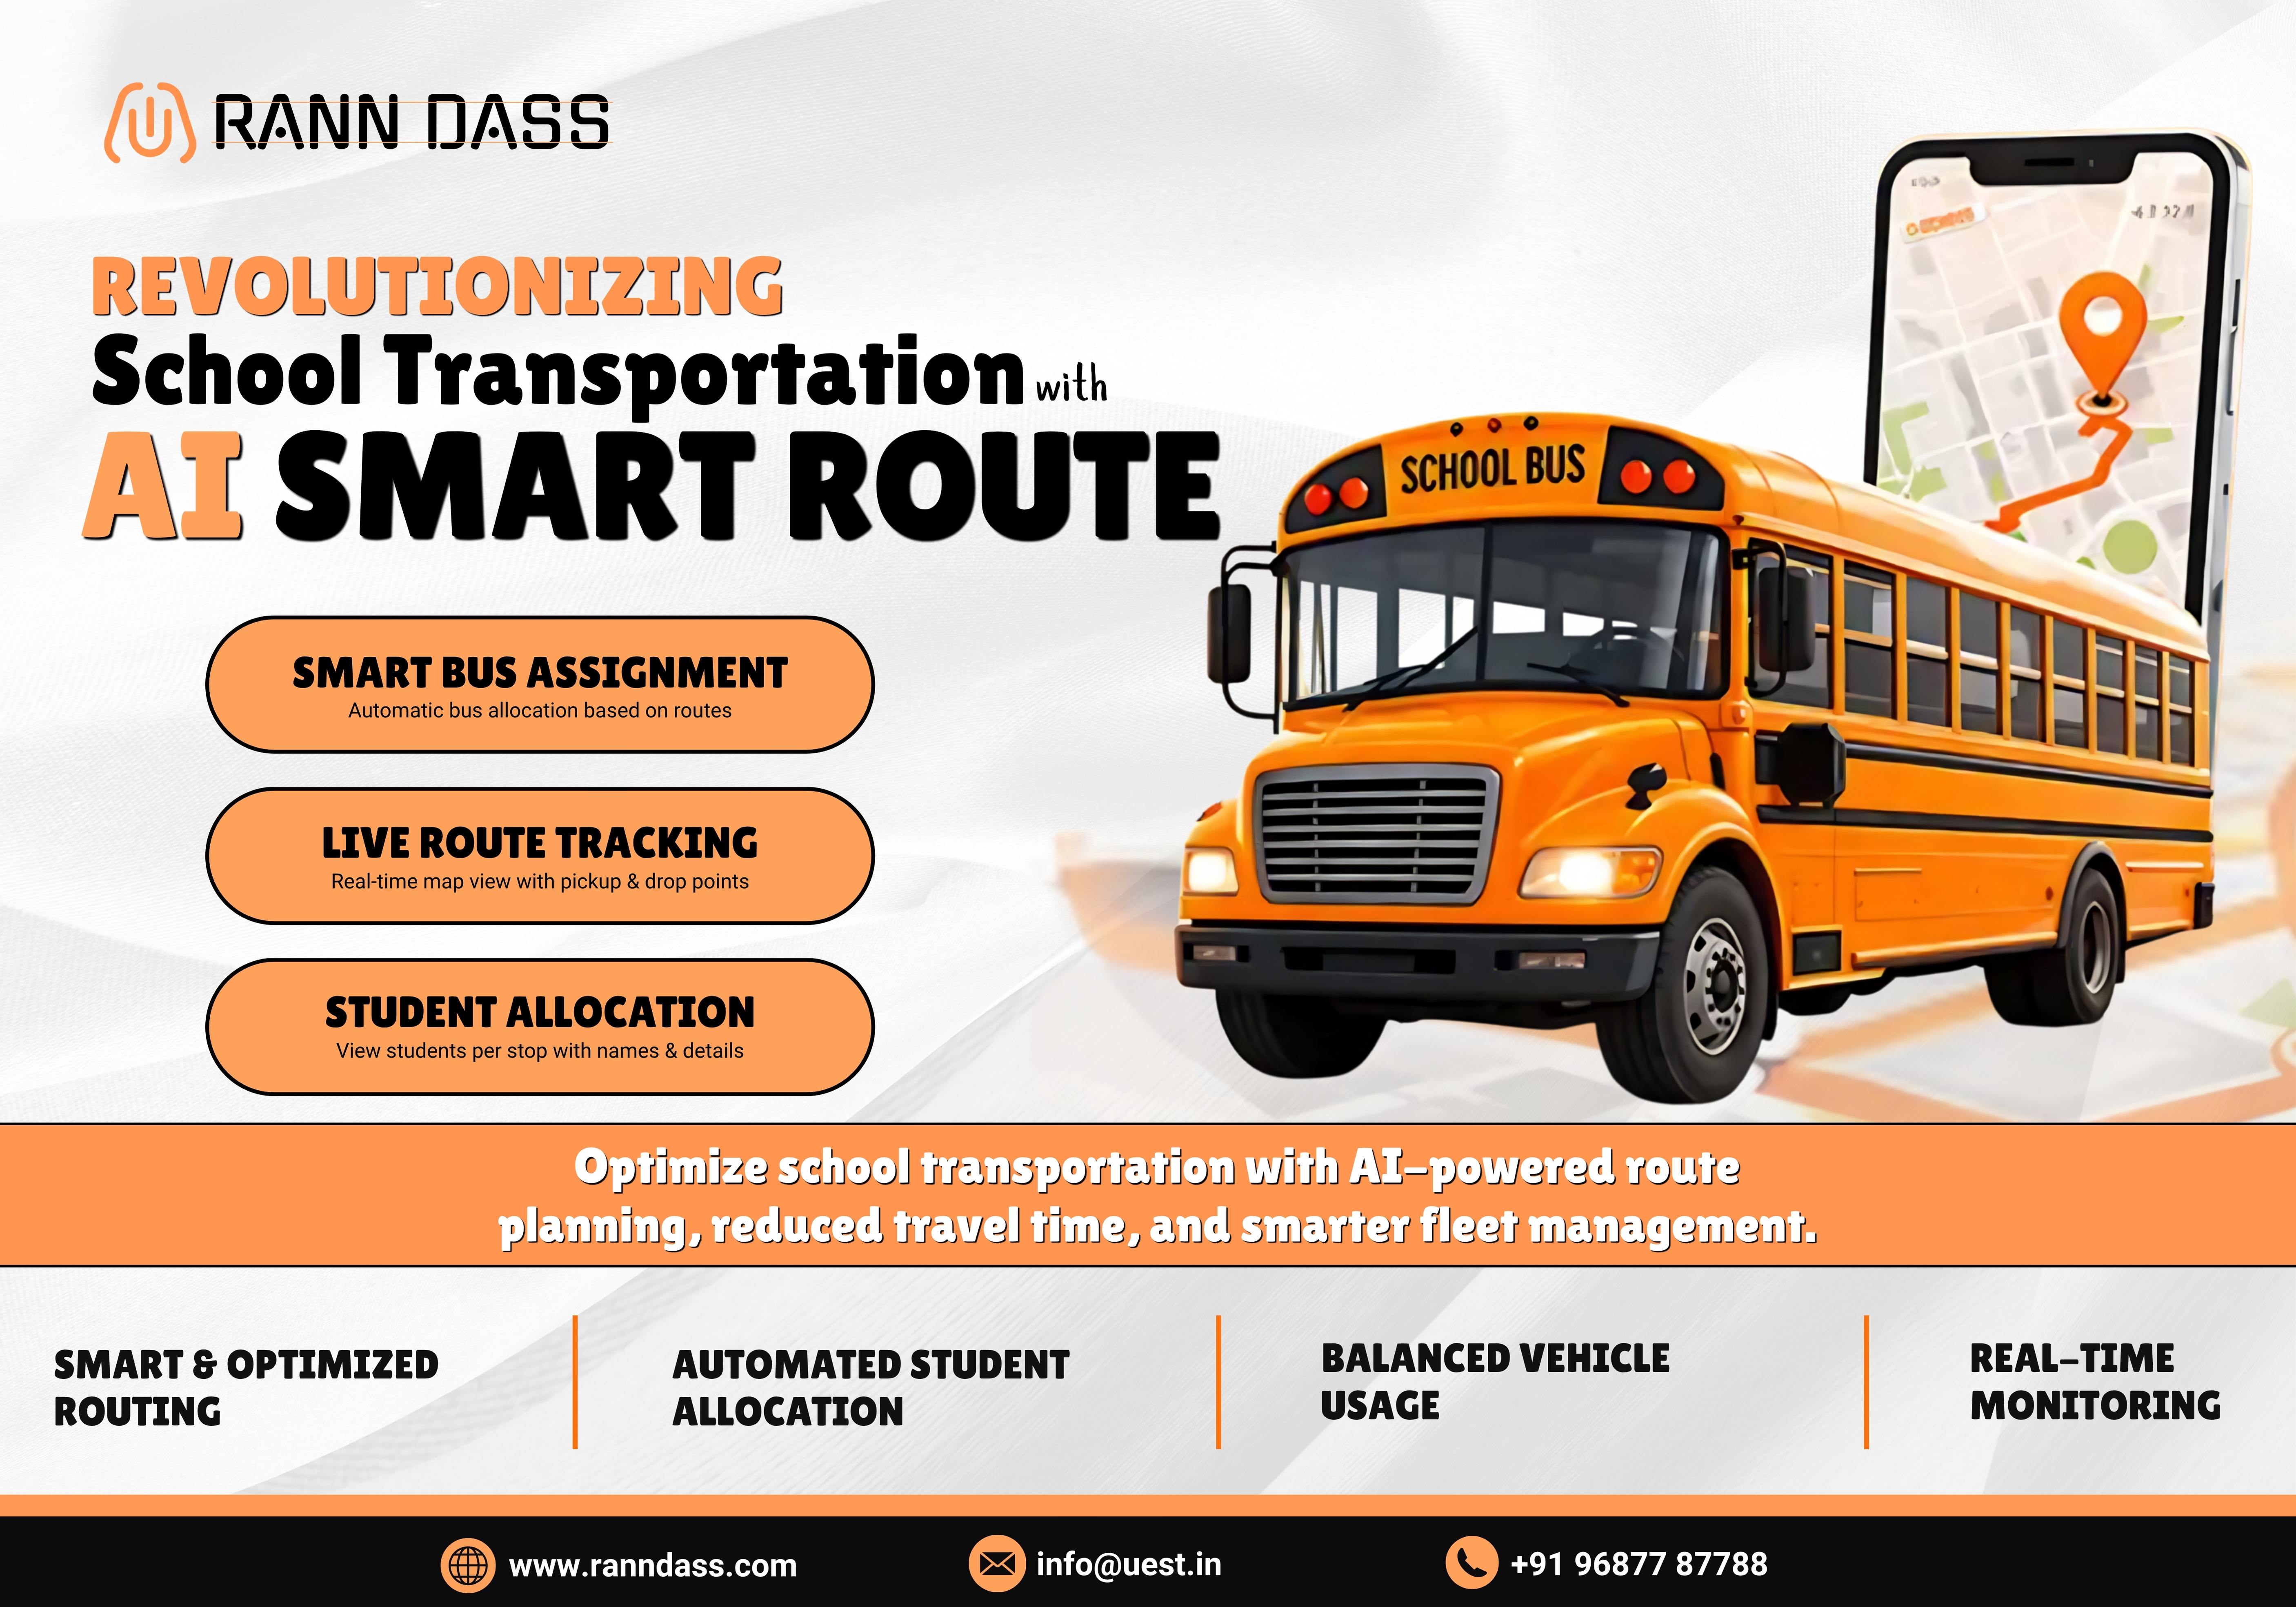
- Smart Transportation ›
- Smart Canteen ›
- Result Analysis Prediction ›
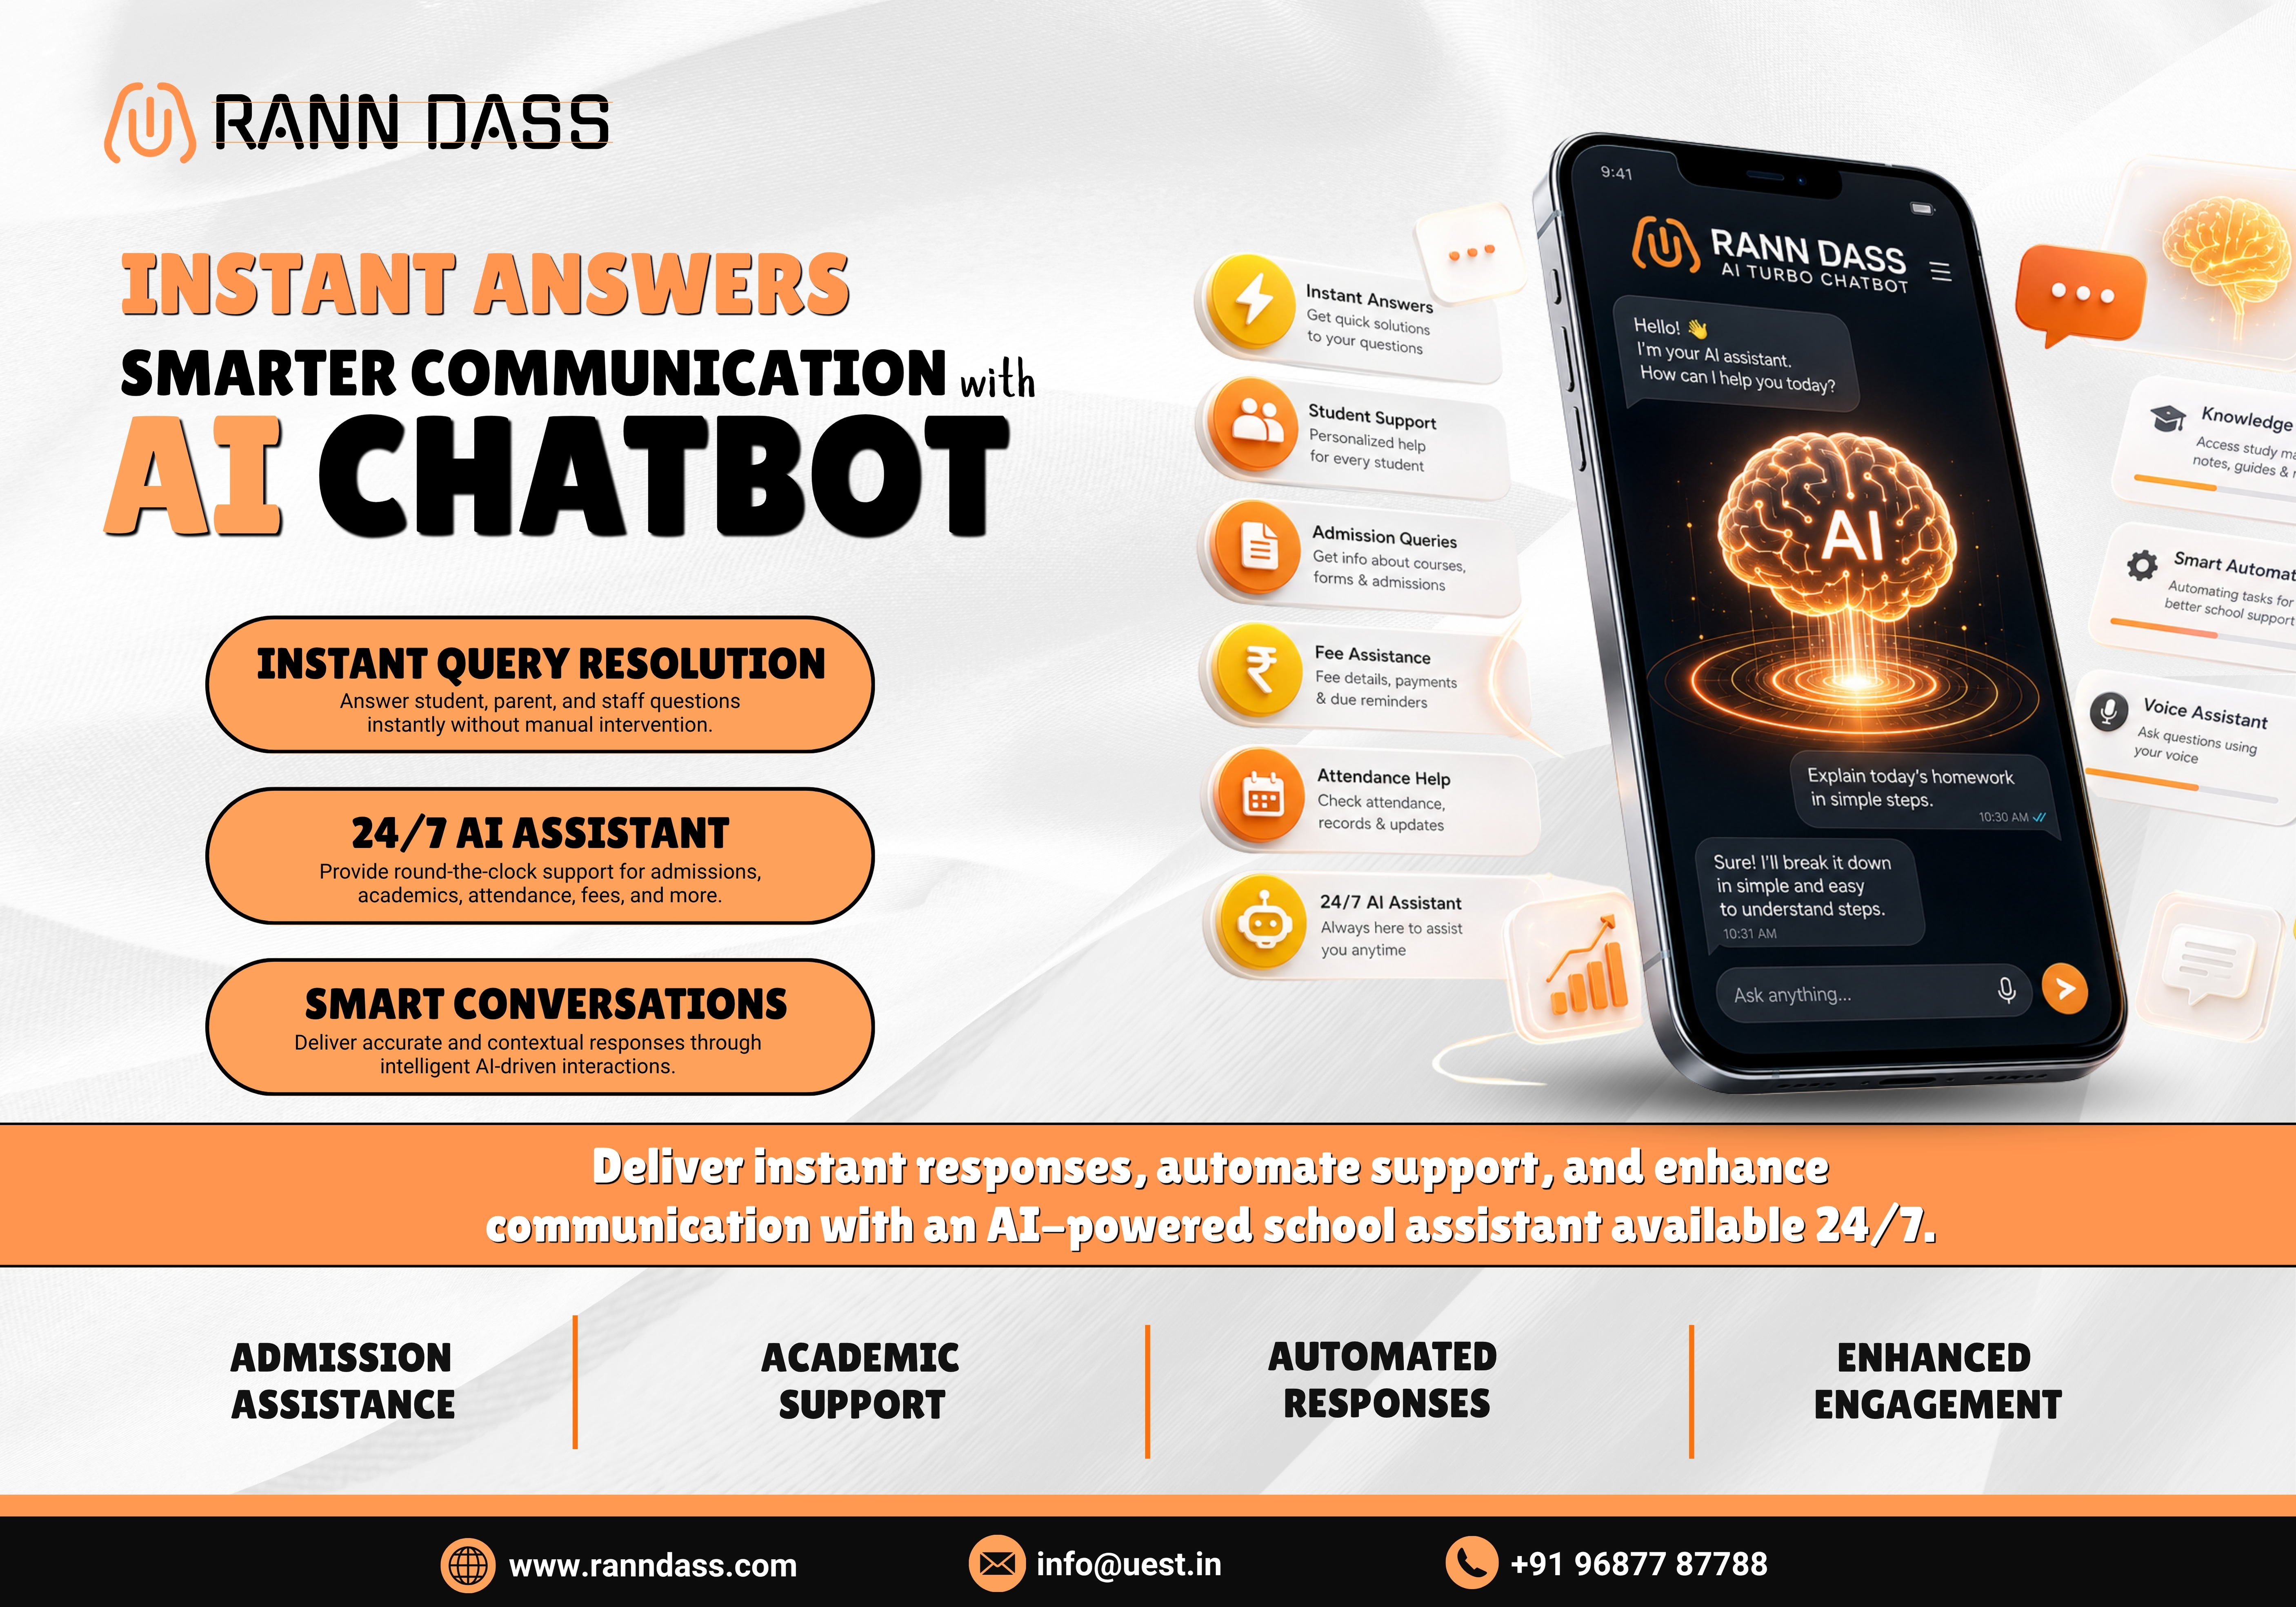
- Smart ChatBot ›
- Smart Timetable ›
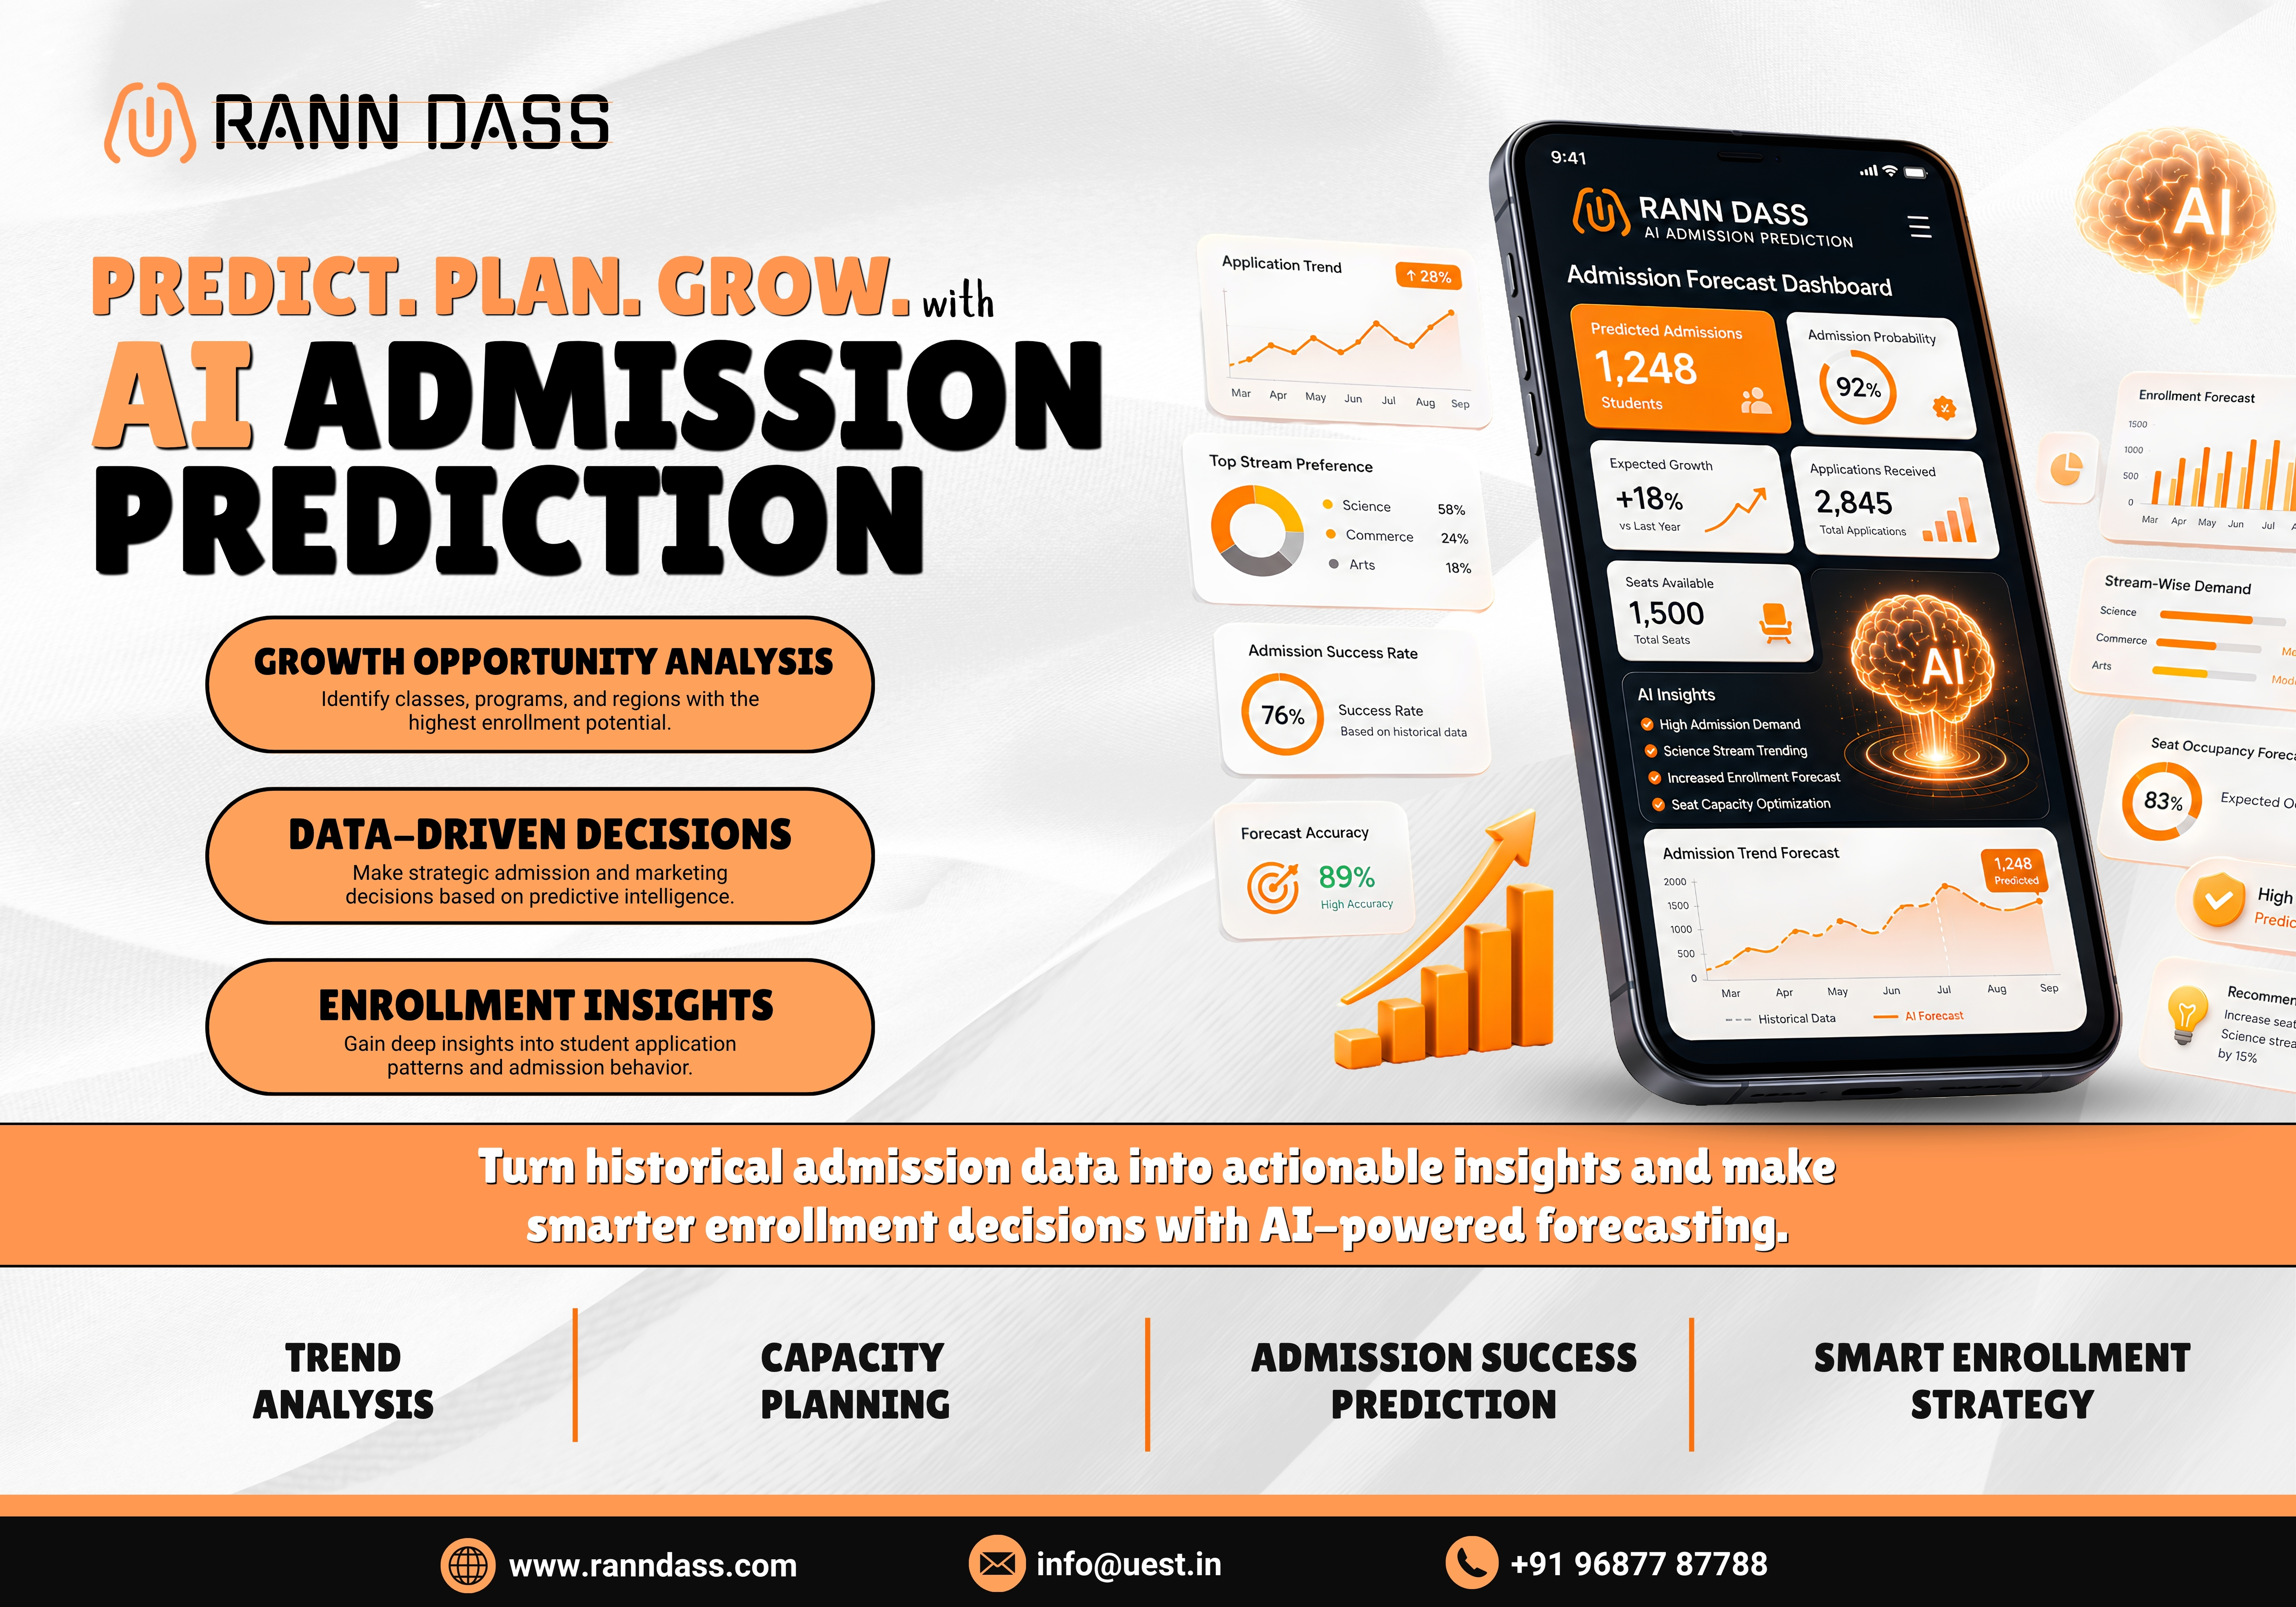
- Admission Prediction ›
- Sports Recommendation ›
FEATURED
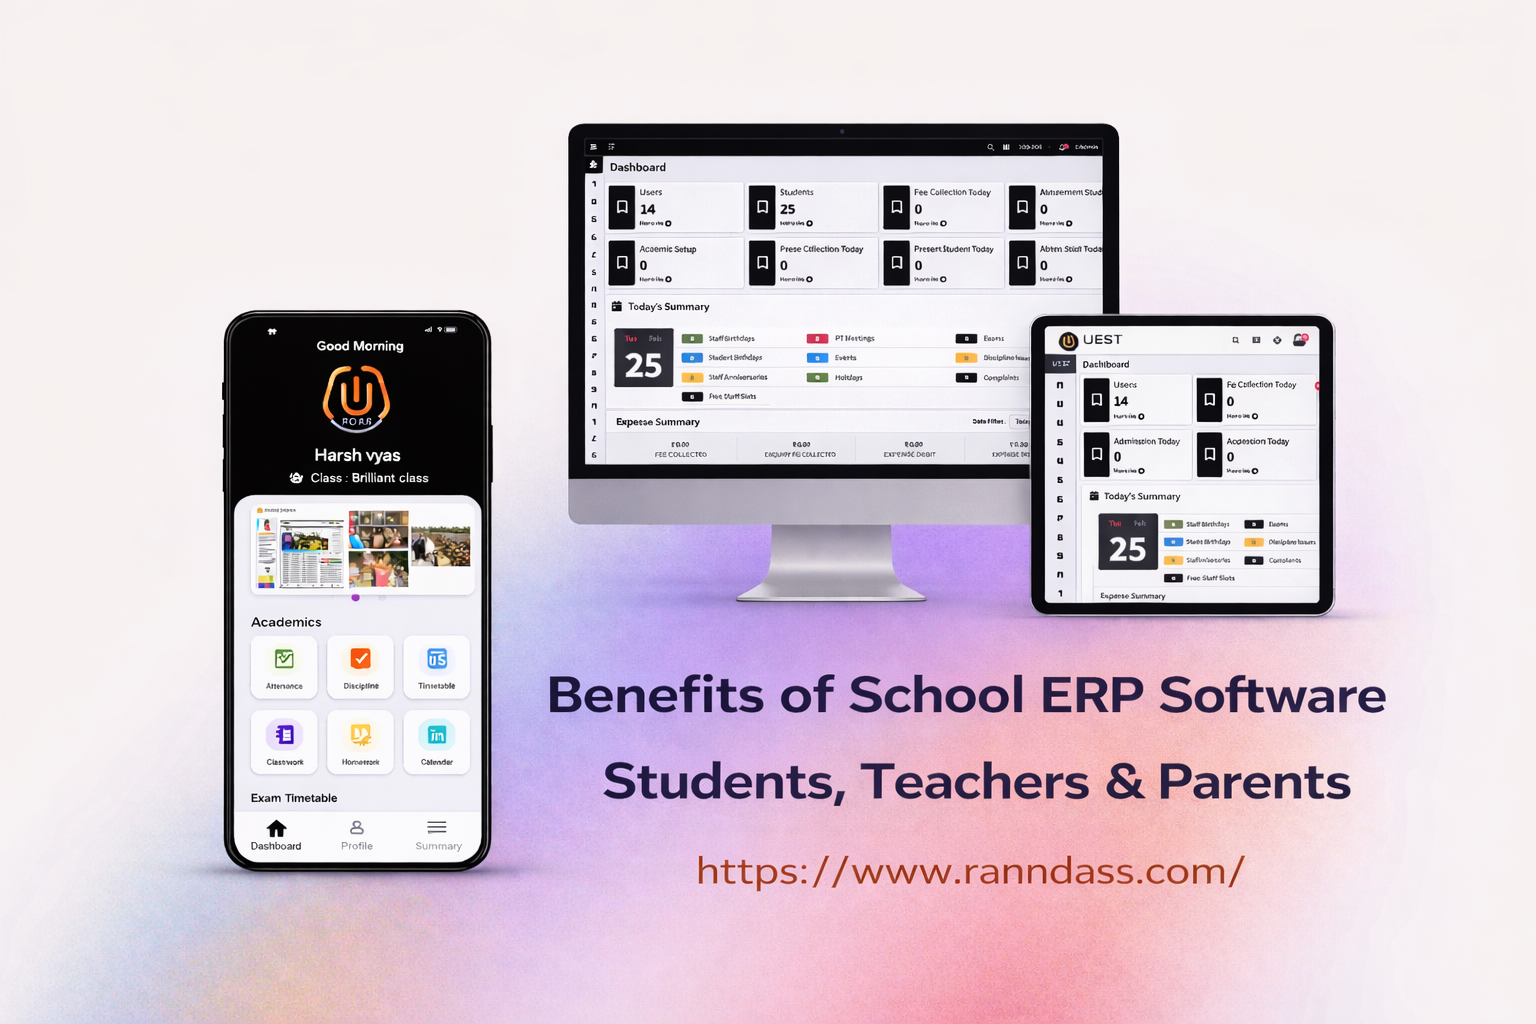
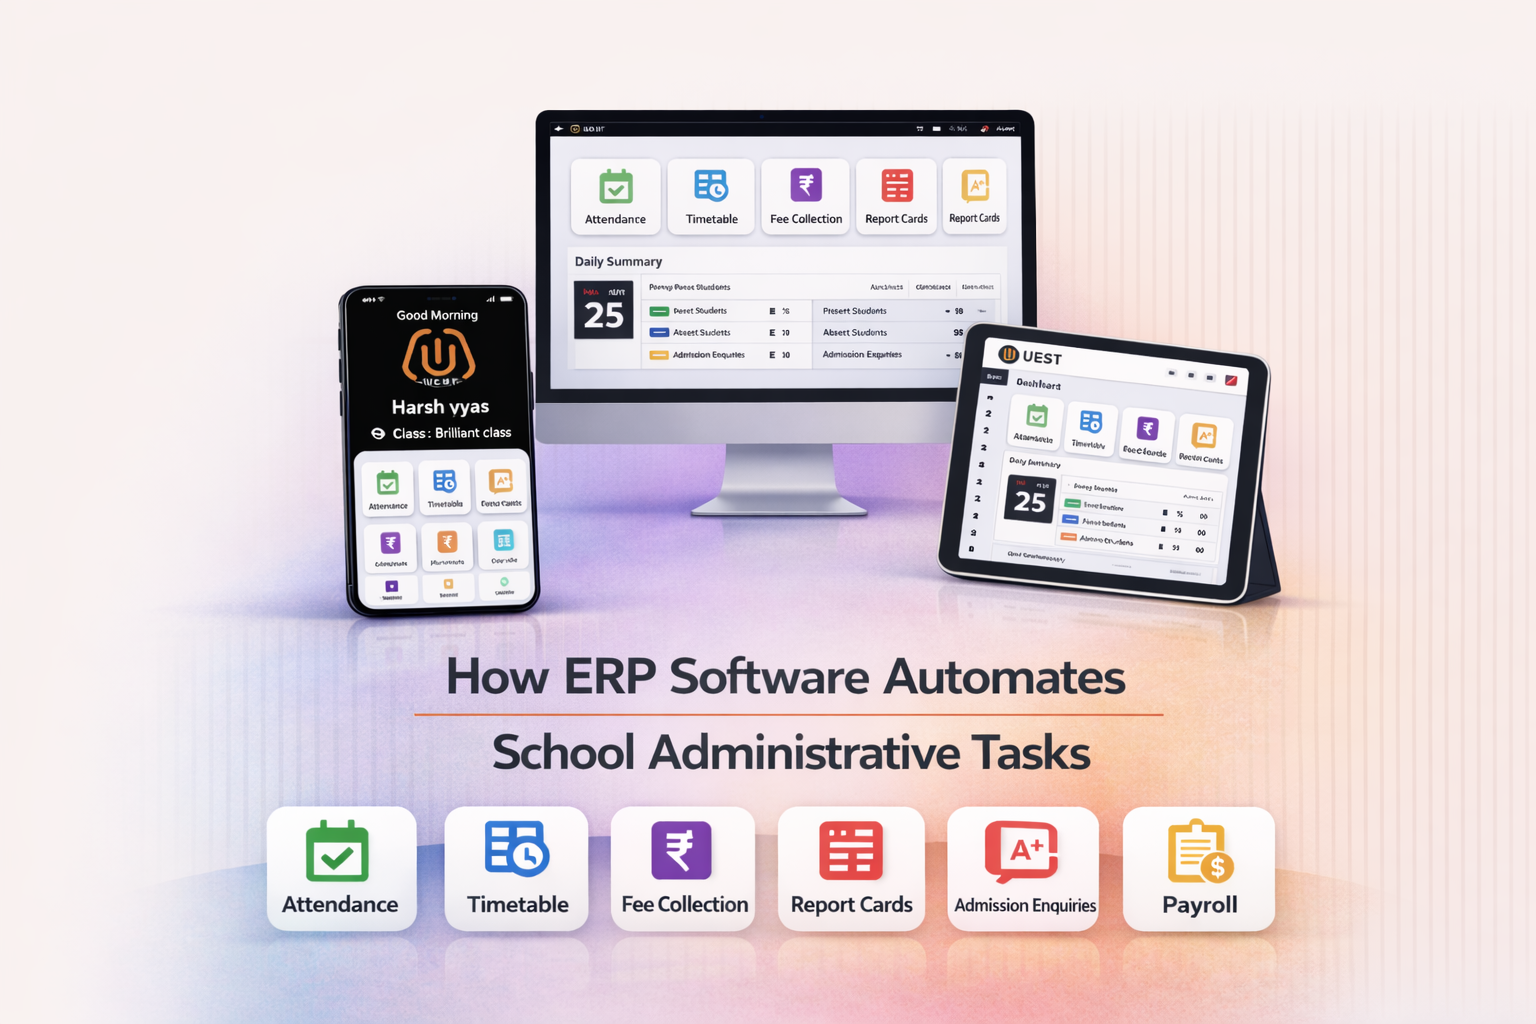
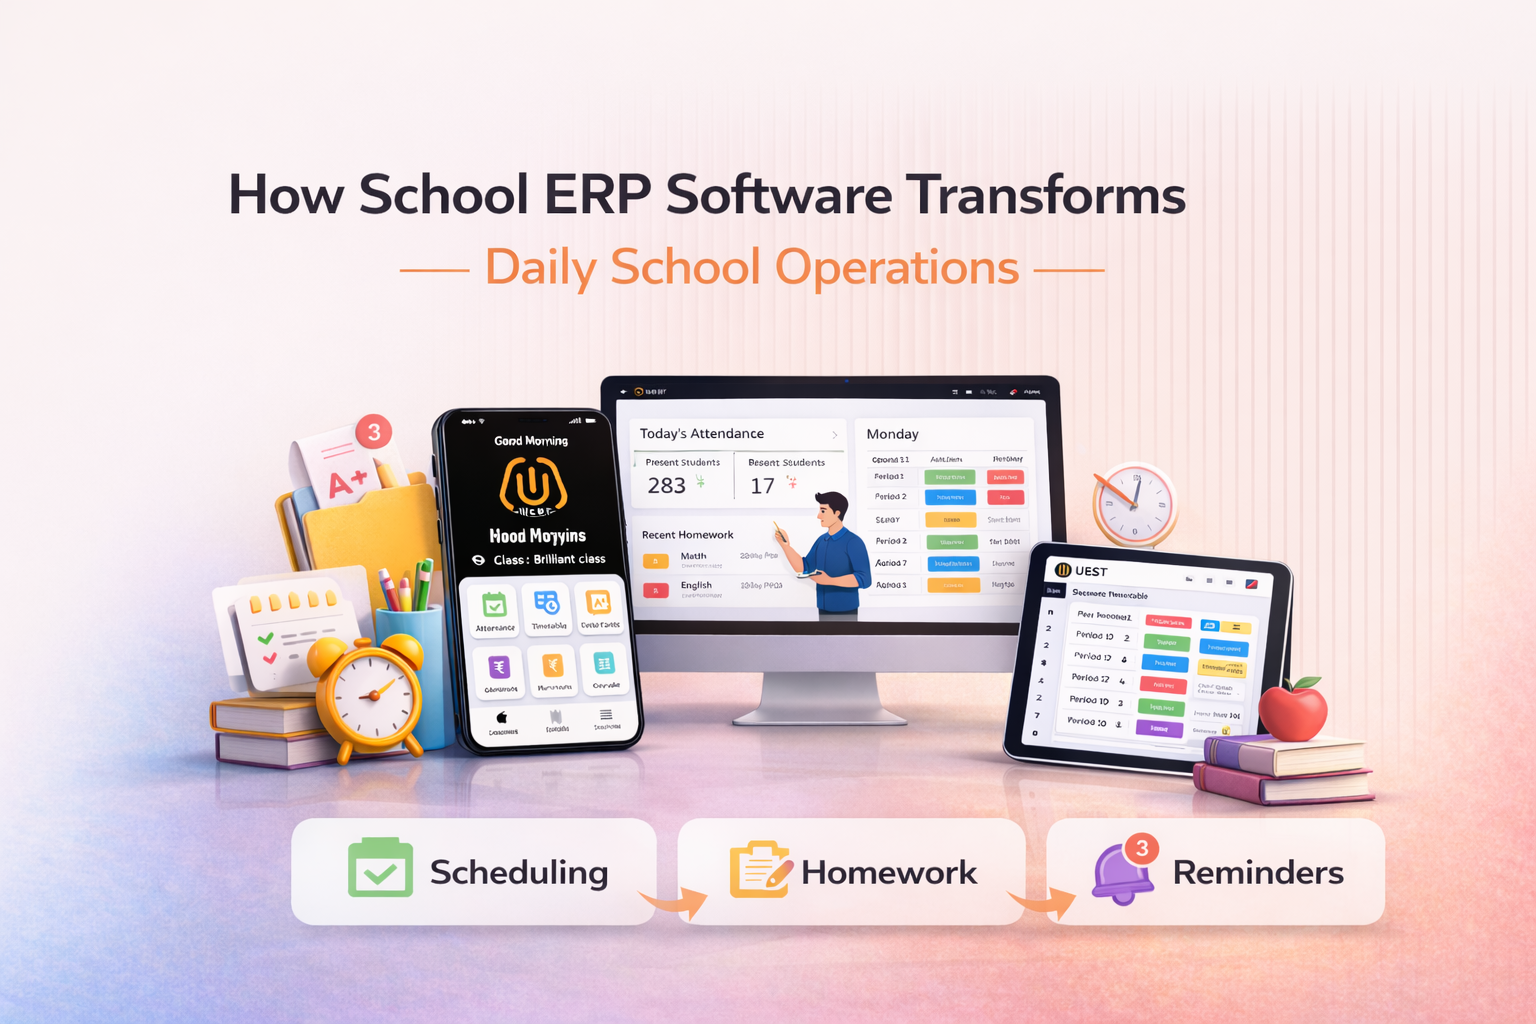
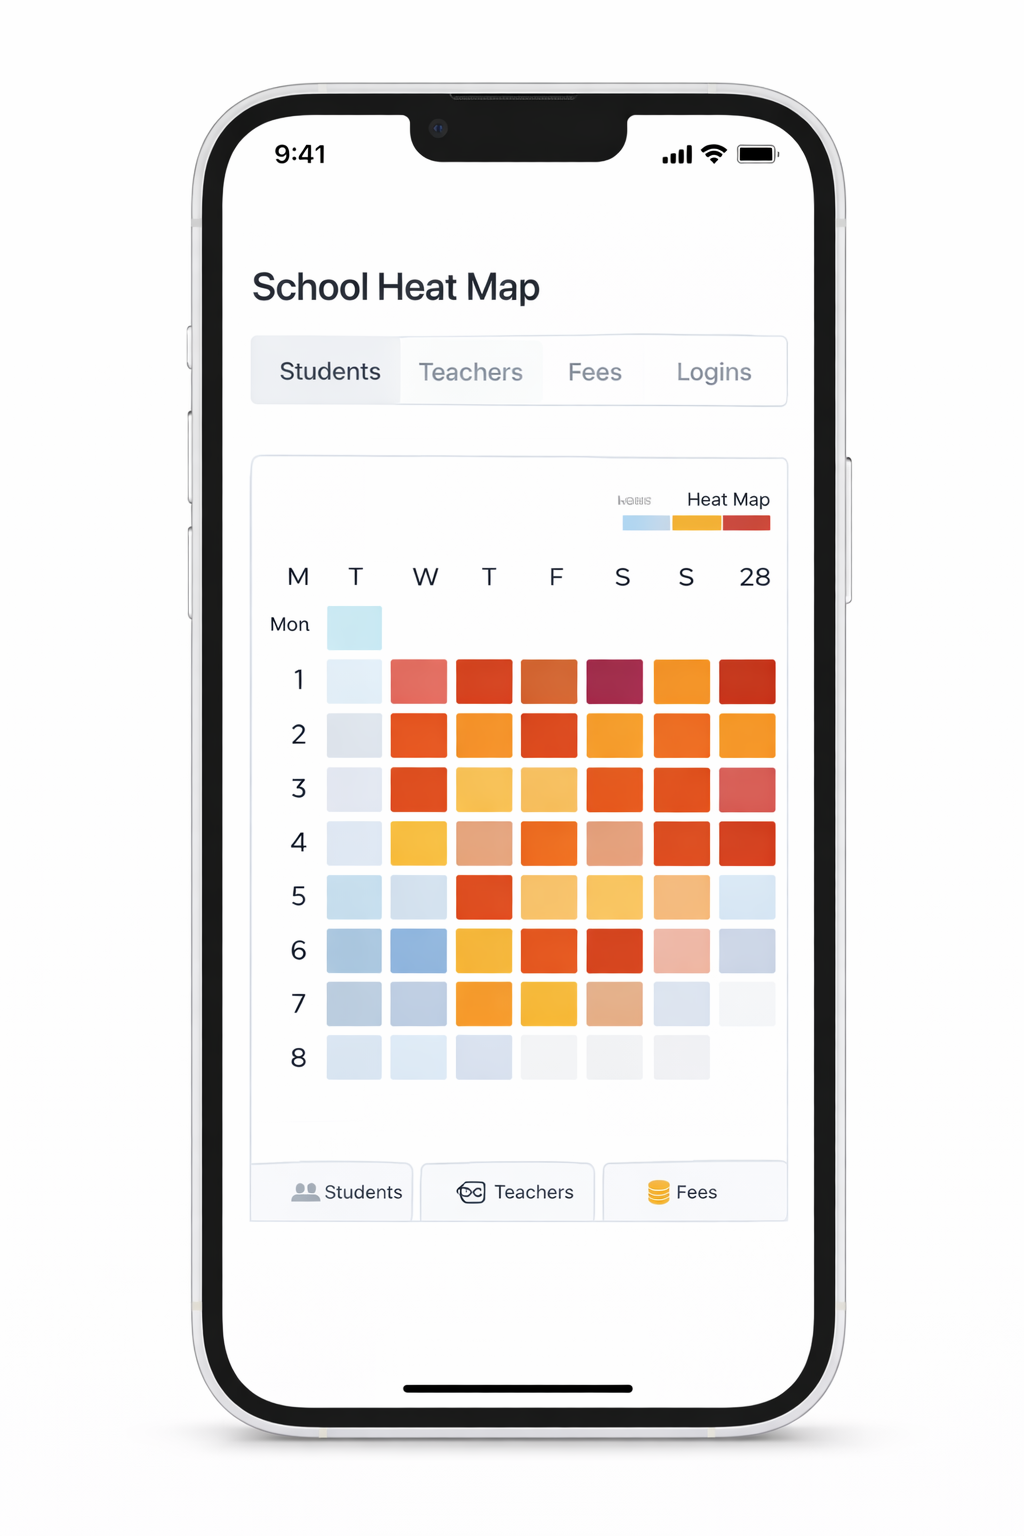
AI School Management Software
Automate your entire school administration with
intelligent
AI — from admissions to reports, everything in one
powerful dashboard.
AI — from admissions to reports, everything in one
powerful dashboard.
10x
Faster admin tasks
98%
Accuracy rate
14+
Schools onboarded
24/7
AI support